These pages allow you to analyse the journals and conferences that publish most frequently on your chosen subject.
Understanding the view
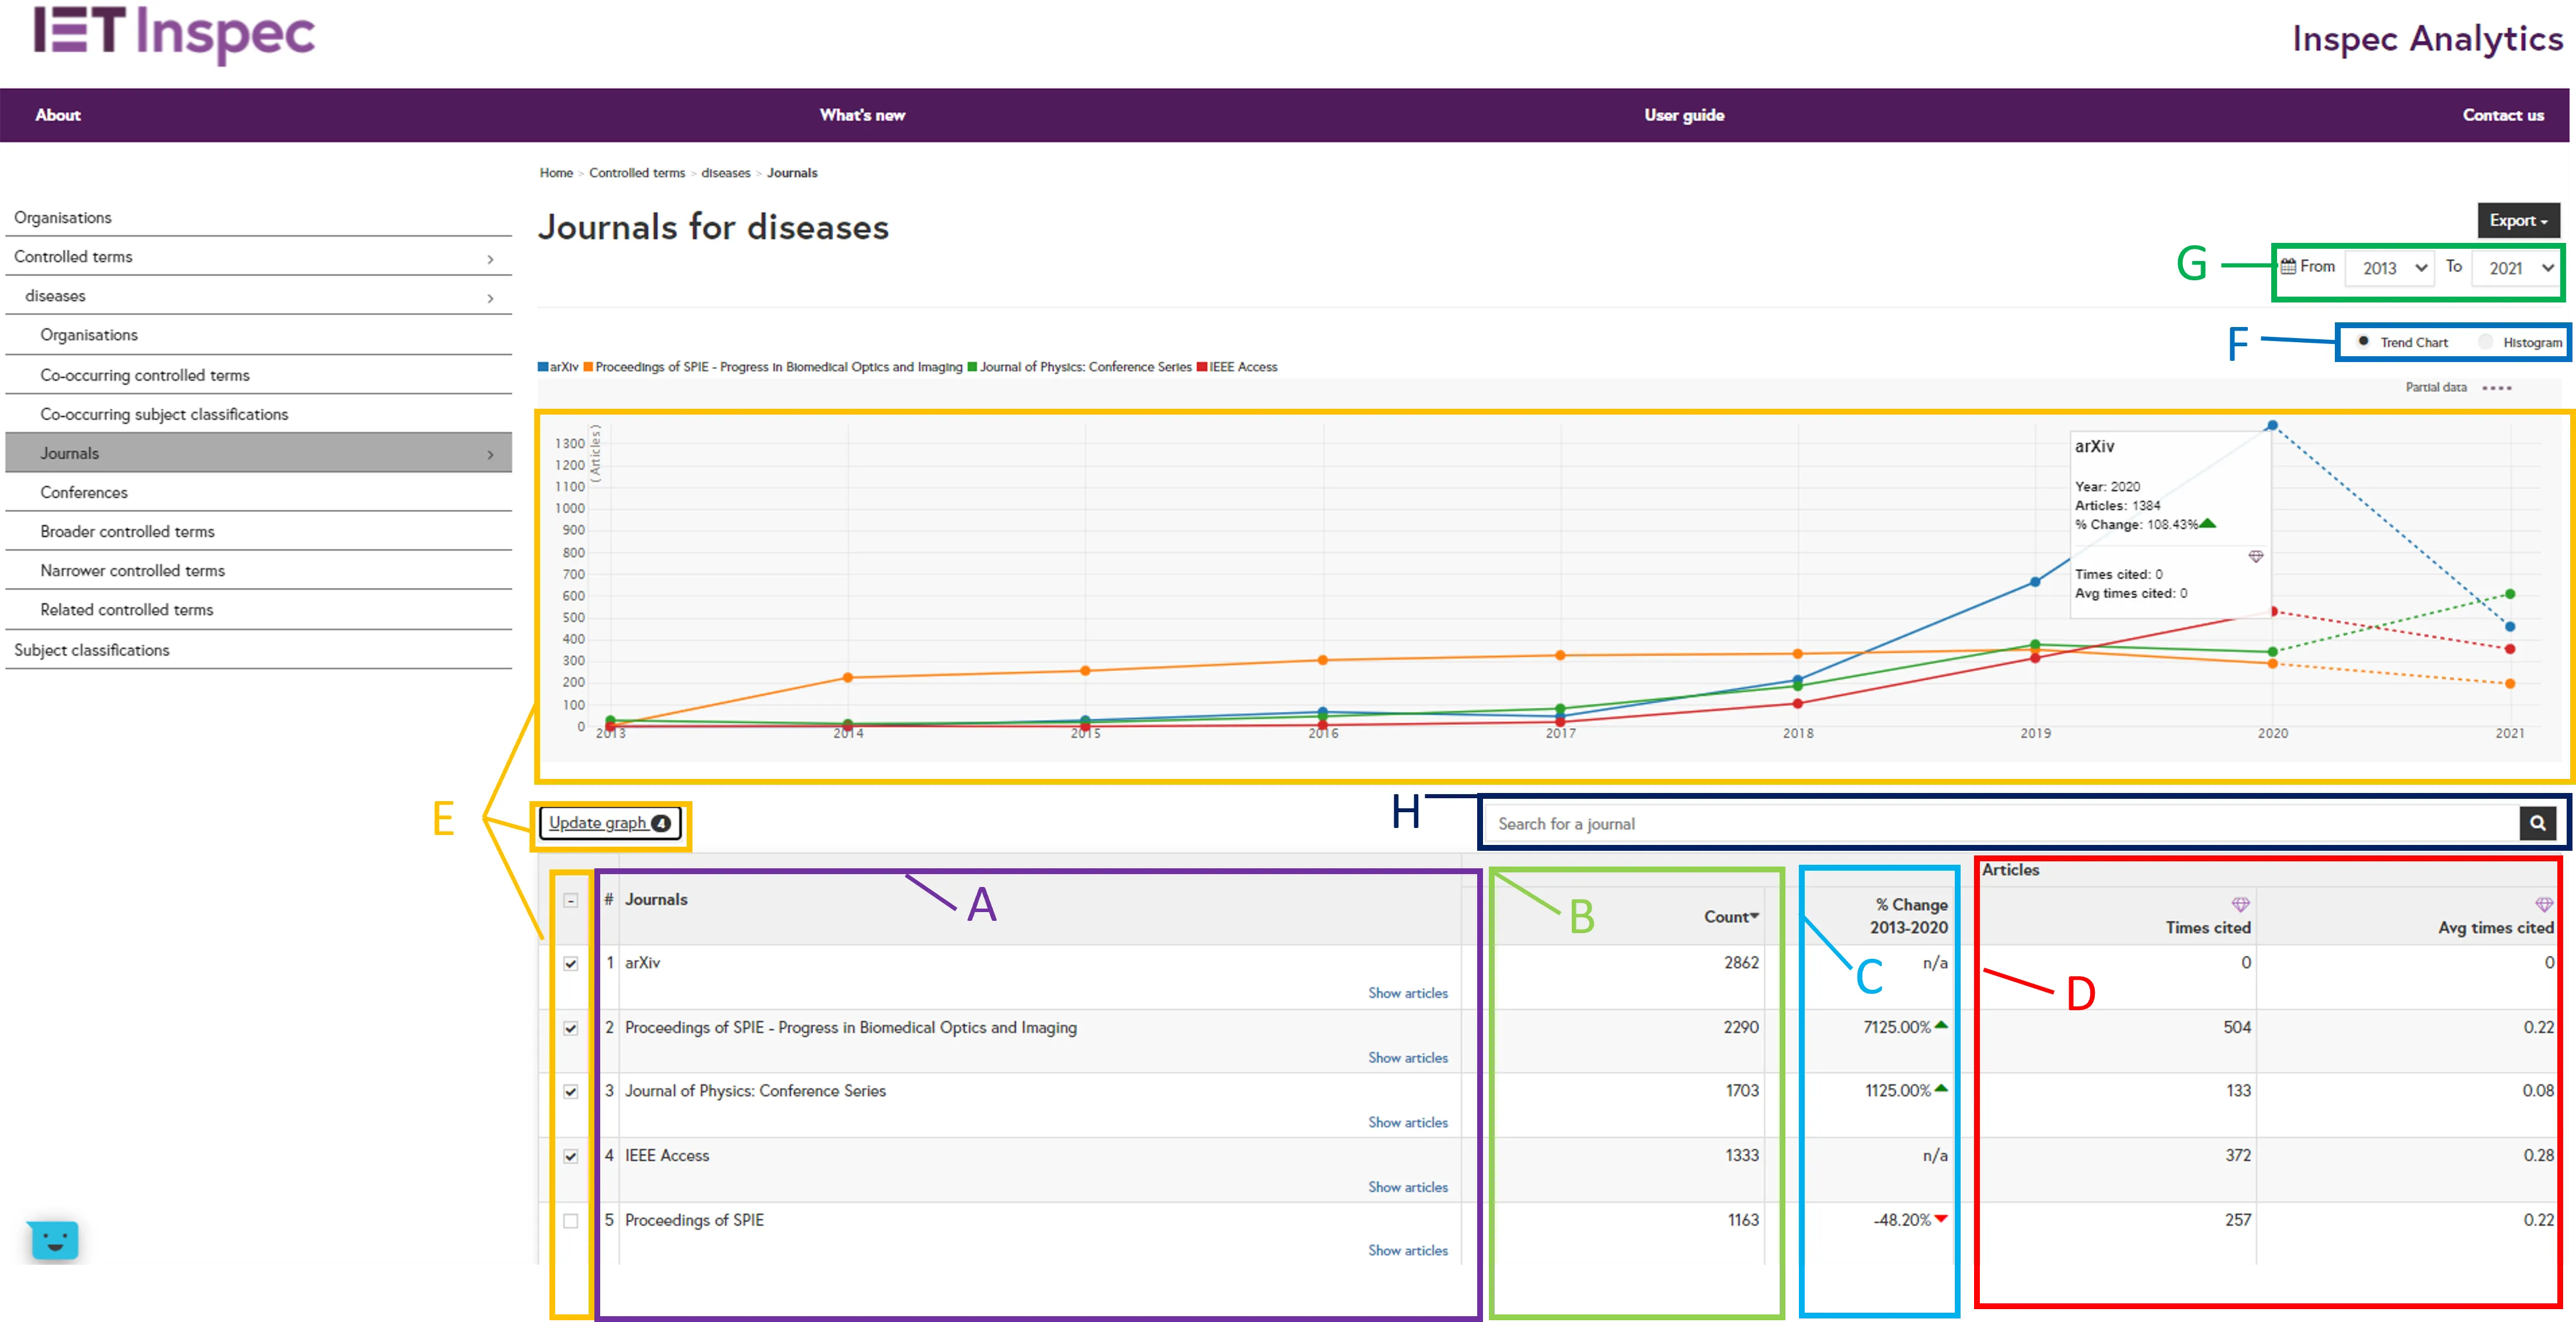
Journals column (A): The table displays the list of journals or conferences that have published on the selected scientific concept.
Article Count (B): For each publication you will see the total number of articles on the selected scientific term that have been indexed in each journal, with the highest total number of articles at the top. Click on a column heading to change or reverse the order.
Percentage Change column (C): The percentage change column shows the total change in research output for each scientific term in the different journals over the selected time period.
Citation columns (D): Inspec Analytics Plus only: The times cited column shows the total number of times these articles have been cited. The average times cited shows the average number of citations per article.
Comparison Graph (E) - (for journals only): To compare research output for a number of publications, select your chosen publications and click “update graph.”
The line graph at the top will display the research output for each publication over time. Hover over the points to display the number of articles and percentage change for each year. Inspec Analytics Plus only: citations are also displayed when hovering over points in the graph.
Change Chart Type (F): To display your results as a histogram chart, select the toggle at the top. Inspec Analytics Plus only: Use the drop-down to update the histogram to show the number of articles, number of citations or the average number of citations.
Date Filters (G): Filter the date range of your results using the “From” and “To” drop-down selections.
Search Bar (H): Use the search box to search for a specific journal or conference.
Exporting your insights
Click on “Export as PDF” at the top of the page to download your current view. The PDF includes a link to your view so you can return directly to the data in the future.
Inspec Analytics Plus only: You can also choose to download your insights as an Excel file.