Understanding the view
Follow the guide below or skip to our walkthrough video.
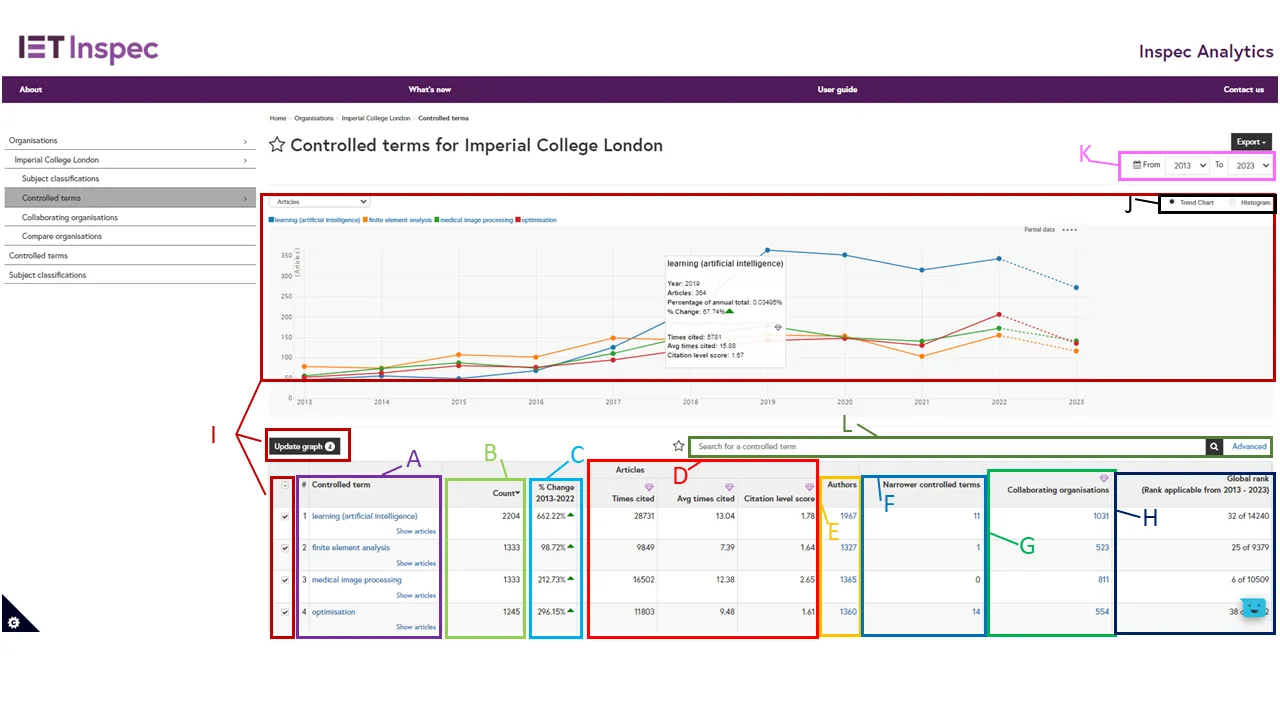
Controlled Terms column (A): The table displays all the controlled terms associated with research from your selected organisation. Terms appear listed in order of research output with the highest total number of articles at the top. Click on a column heading to change or reverse the order.
Article Count column (B): For each term you will see the total number of articles that your selected organisation has published with that controlled term.
Percentage Change column (C): The percentage change column shows the change in your selected organisation’s research output for this controlled term over the selected time period.
Citation columns (D) - Inspec Analytics Plus only: The times cited column shows the total number of times these articles have been cited. The average times cited shows the average number of citations per article. Citation level score shows how an organisation’s average citations on a subject compare to the global average for the subject.
Authors column (E): For each term you can see the number of author names for articles associated with the selected concept and organisation. Click on the number to view and explore the list of authors in the Authors Page.
Narrower Controlled Terms (F): This figure represents the number of narrower terms within Inspec’s thesaurus hierarchy where the organisation has published research. Click on the number to view and explore these narrower controlled terms for the organisation.
Collaborating Organisations column (G) - Inspec Analytics Plus only: This shows the number of organisations collaborating with the selected organisation on the selected subject. Click on the number to view and explore all organisations collaborating on the selected subject in more detail.
Organisation’s Global Rank column (H): For each term you will see where this output ranks the organisation among all organisations publishing on that subject.
Comparison Graph (I): To compare output for a number of terms, select your chosen subjects and click “update graph”. The line graph at the top will display the research output for each of your selected subjects over time. Hover over the points to display the number of articles and percentage change for each year. This shows the total percentage change of article across the selected years. The arrow indicates an increase or decrease in article output. Inspec Analytics Plus only: citations are also displayed when hovering over points in the graph.
Change Chart Type (J): To display your results as a histogram chart, select the toggle at the top. Inspec Analytics Plus only: Use the drop-down to update the histogram to show number of articles, number of citations or average number of citations.
Date Filters (K): Filter the date range of your results using the “From” and “To” drop-down selections.
Advanced Search (L): Search for a term using the search box, or click “Advanced” for advanced search options:
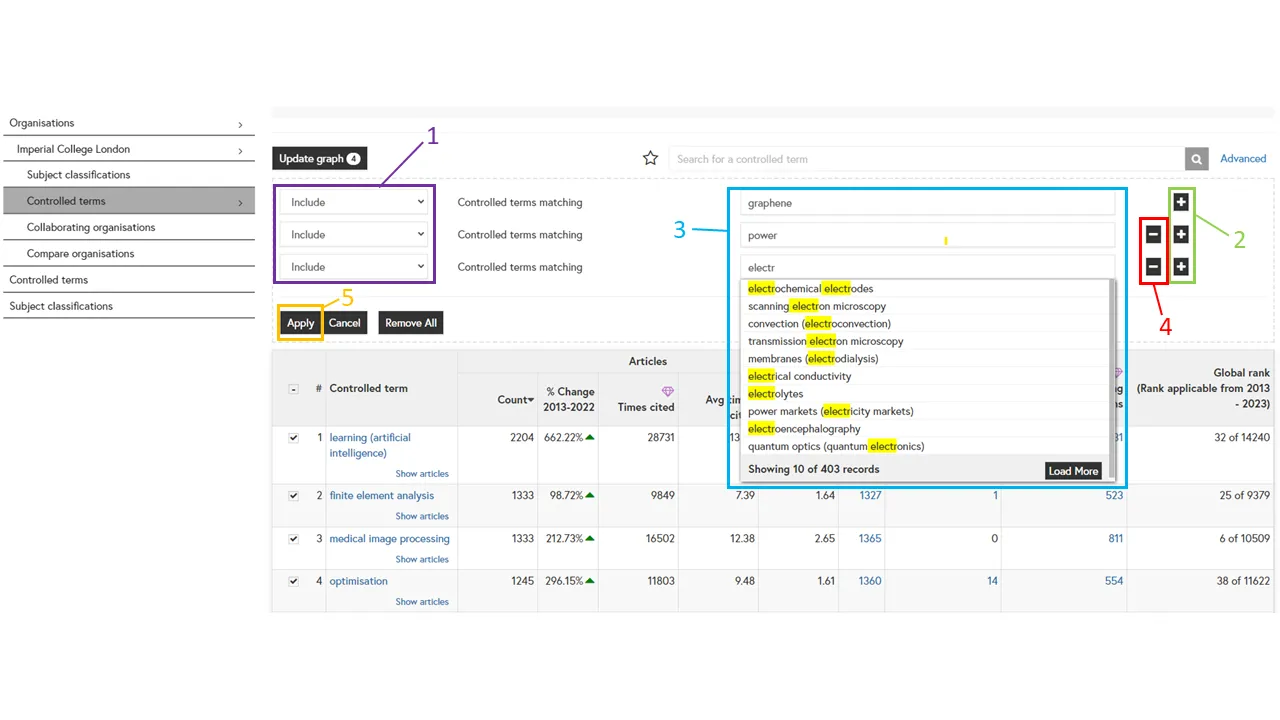
Advanced Search (1): Use the drop-down to select “Include” or “Exclude” search terms.
Advanced Search (2): Add multiple conditions. Each condition will be treated as “OR”.
Advanced Search (3): Search for whole words, partial words or start typing to see suggestions and select an organisation.
Advanced Search (4): Remove conditions by clicking on the corresponding “X” or by clicking “remove all”.
Advanced Search (5): Click “Apply” to see your results.
Exporting your insights
Click on "Export as PDF" at the top of the page to download your current view. The PDF includes a link to your view so you can see return directly to the data in the future.
Inspec Analytics Plus only: You can also choose to download your insights as an Excel file.