Understanding the view
Follow our guide below or skip to our walkthrough video.
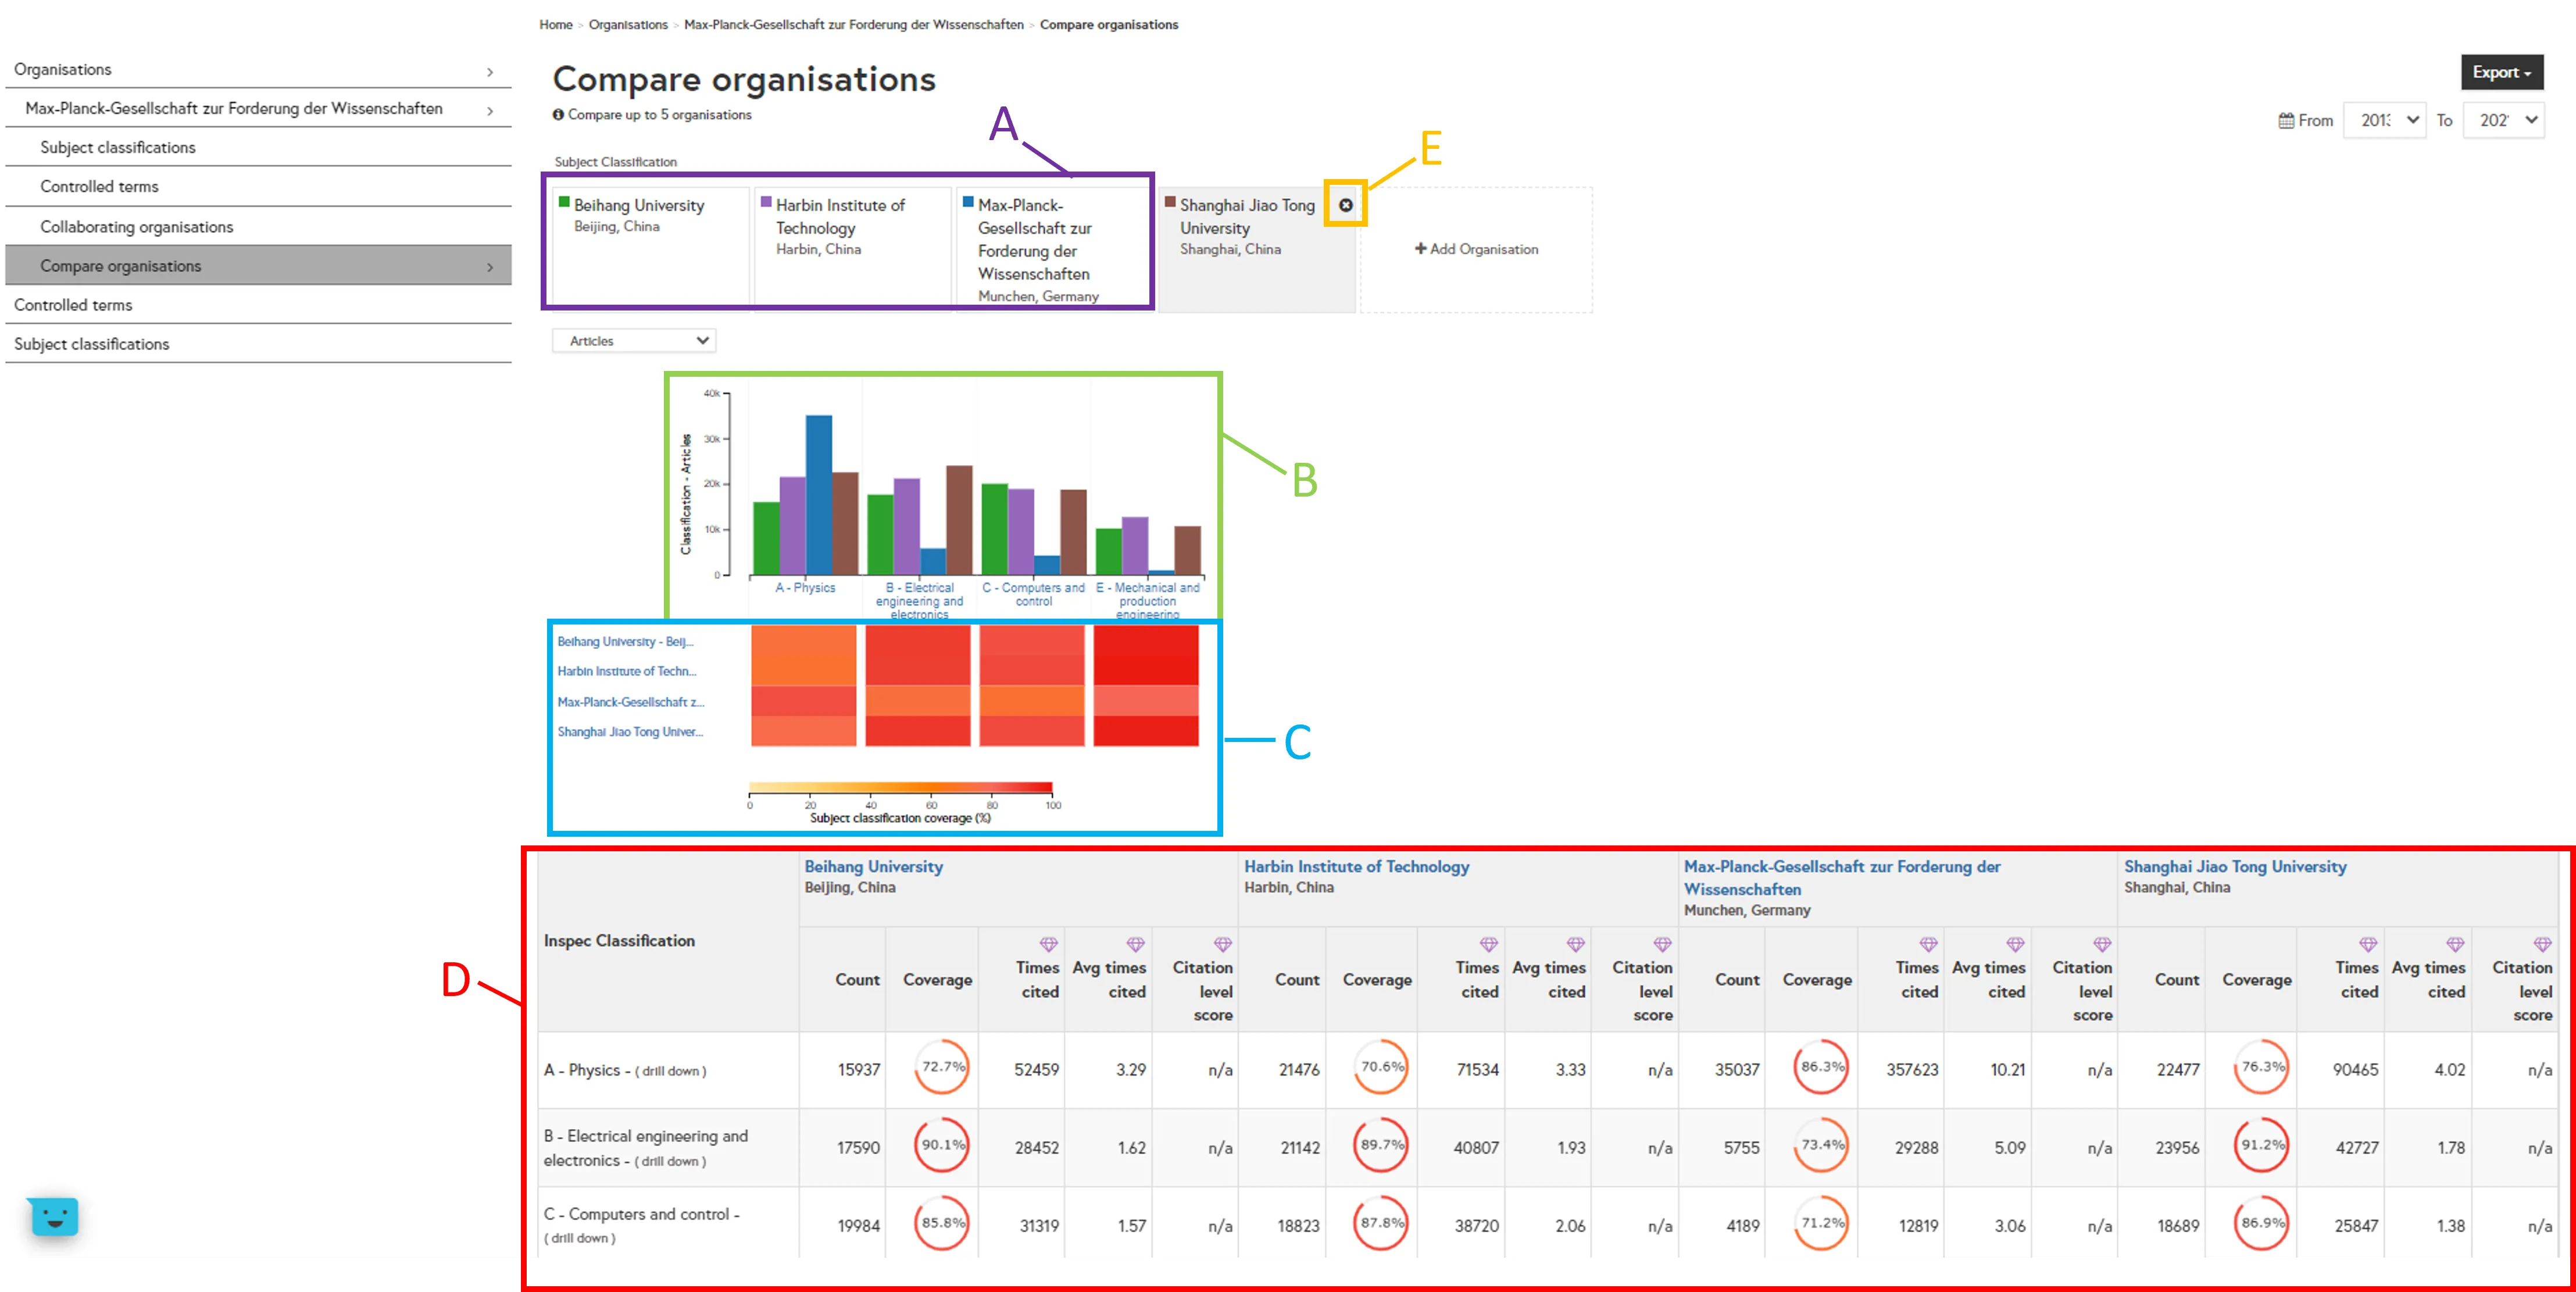
Organisation Key (A): A key detailing the organisation name and their corresponding chart colour is shown at the top.
Histogram Chart (B): The histogram shows the total number of articles for each of your selected organisations within each subject classification. Inspec Analytics Plus only: Use the drop-down to update the histogram to show number of articles, number of citations or average number of citations.
Heatmap (C): A heatmap below shows the subject classification coverage for each organisation. The warmer colours indicate a broader coverage within the subject.
Comparison Table (D): The table below shows the full figures including total number of articles, articles by subject and subject coverage. Inspec Analytics Plus only: The times cited column shows the total number of times these articles have been cited. The average times cited shows the average number of citations per article. Citation level score shows the organisation’s average number of citations on a subject compared to the global average for the subject.
Add/Remove Organisations (E): Remove organisations from your comparison by hovering over an organisation name and clicking on the X. Add a new organisation by clicking “Add organisation” and searching for your chosen organisation in the search box. Click on your chosen organisation name to add it to the comparison. N.B. “Add organisation” only appears when there are less than five organisations in the organisation comparison.
Filtering your view
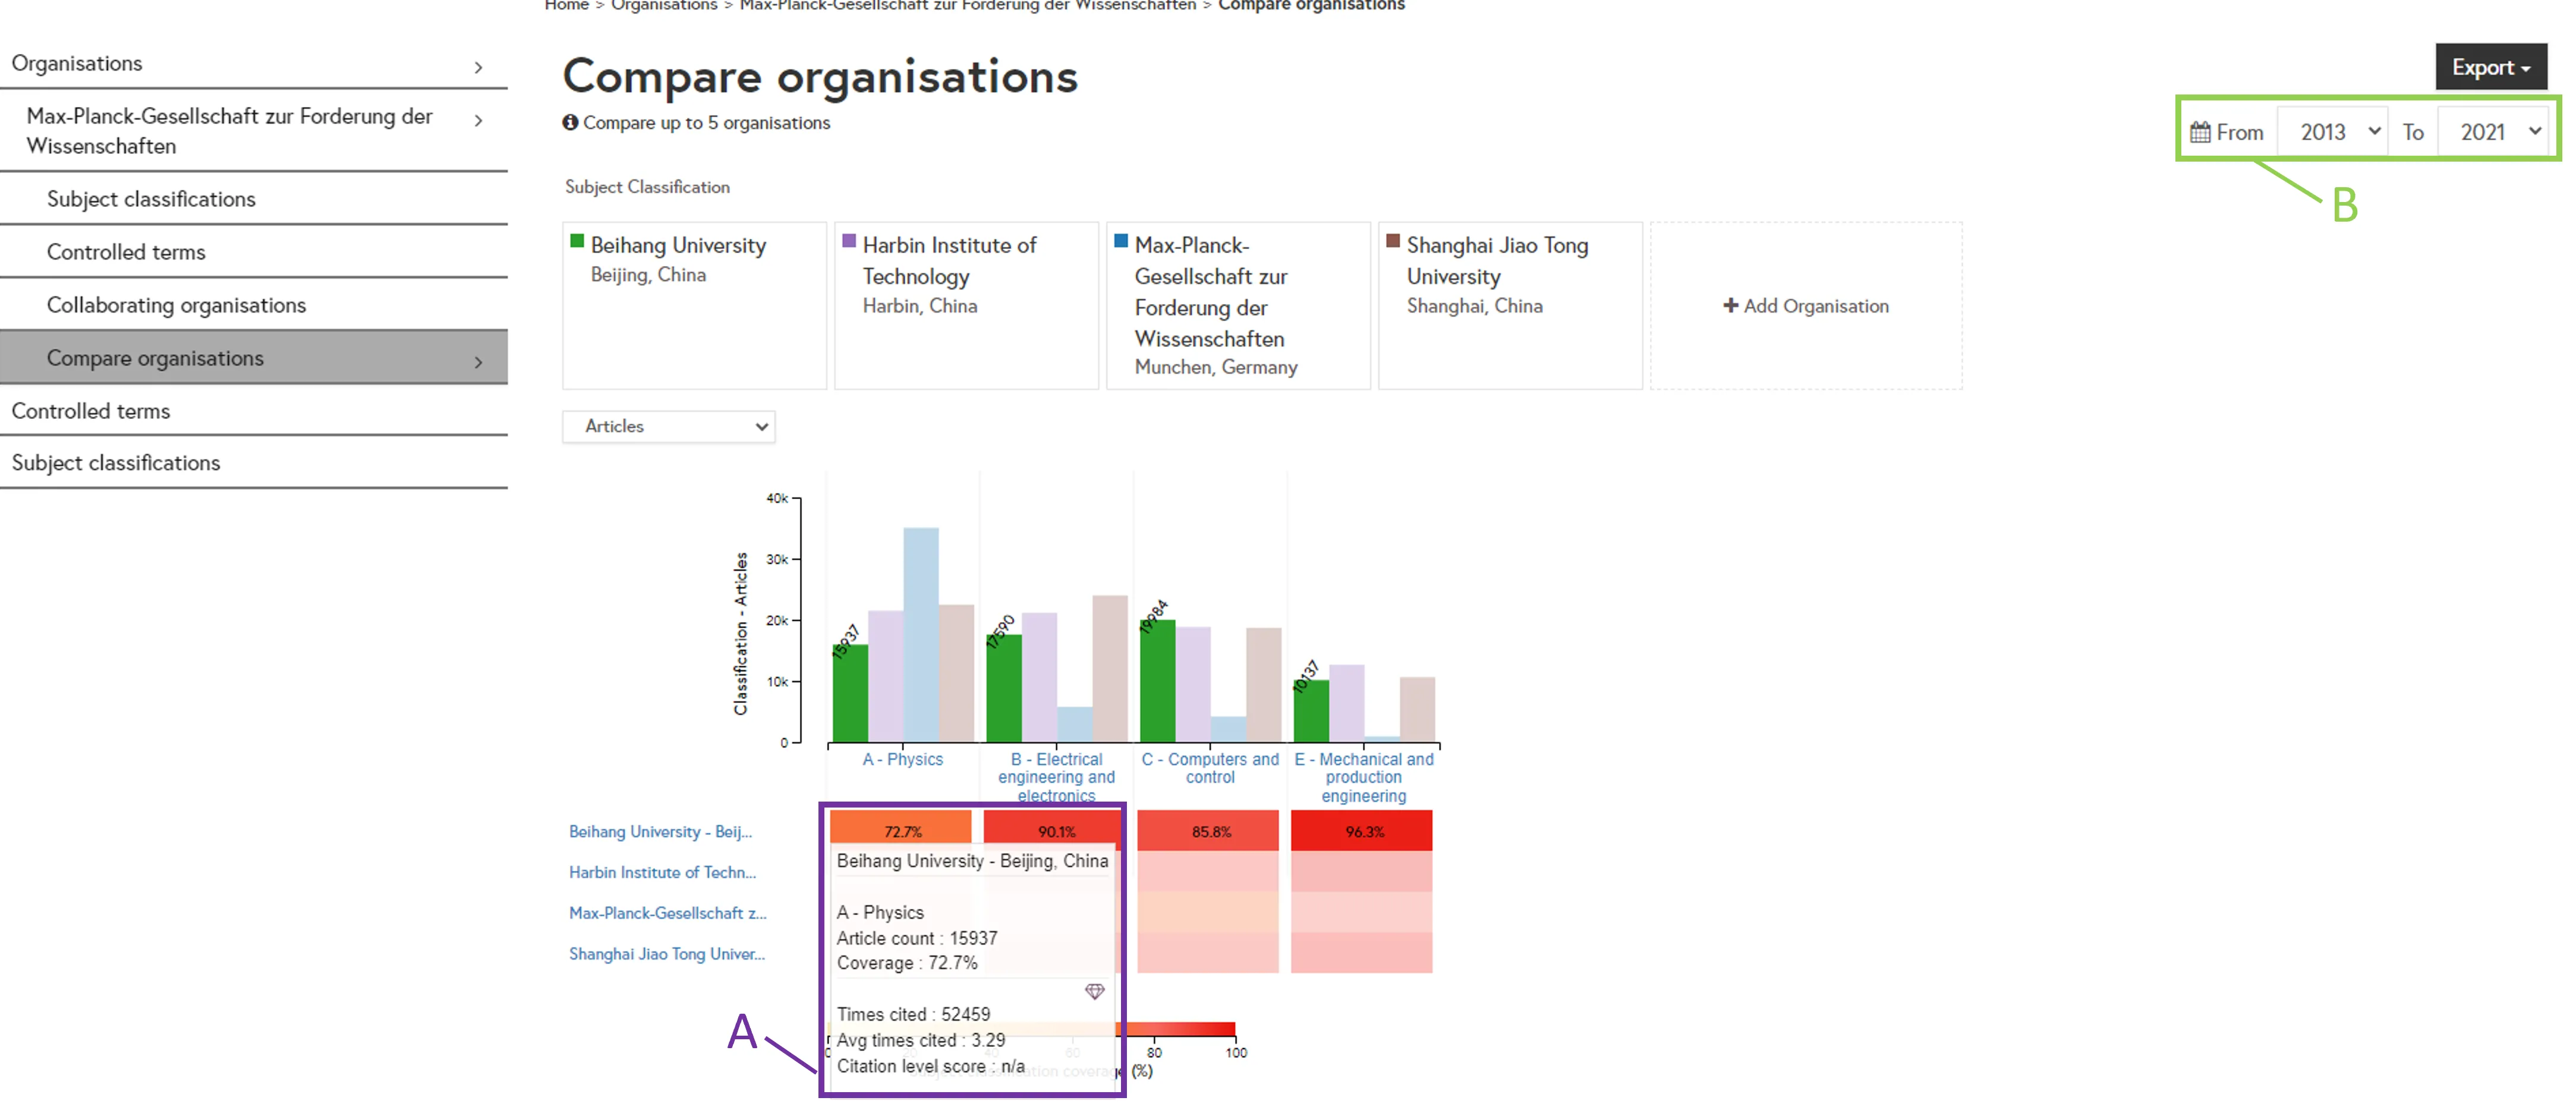
Highlight an Organisation (A): Hover over each organisation to highlight it within the charts.
Date Filters (B): Filter the date range of your results using the “From” and “To” drop-down selections.
Drilling down through Inspec subject classifications
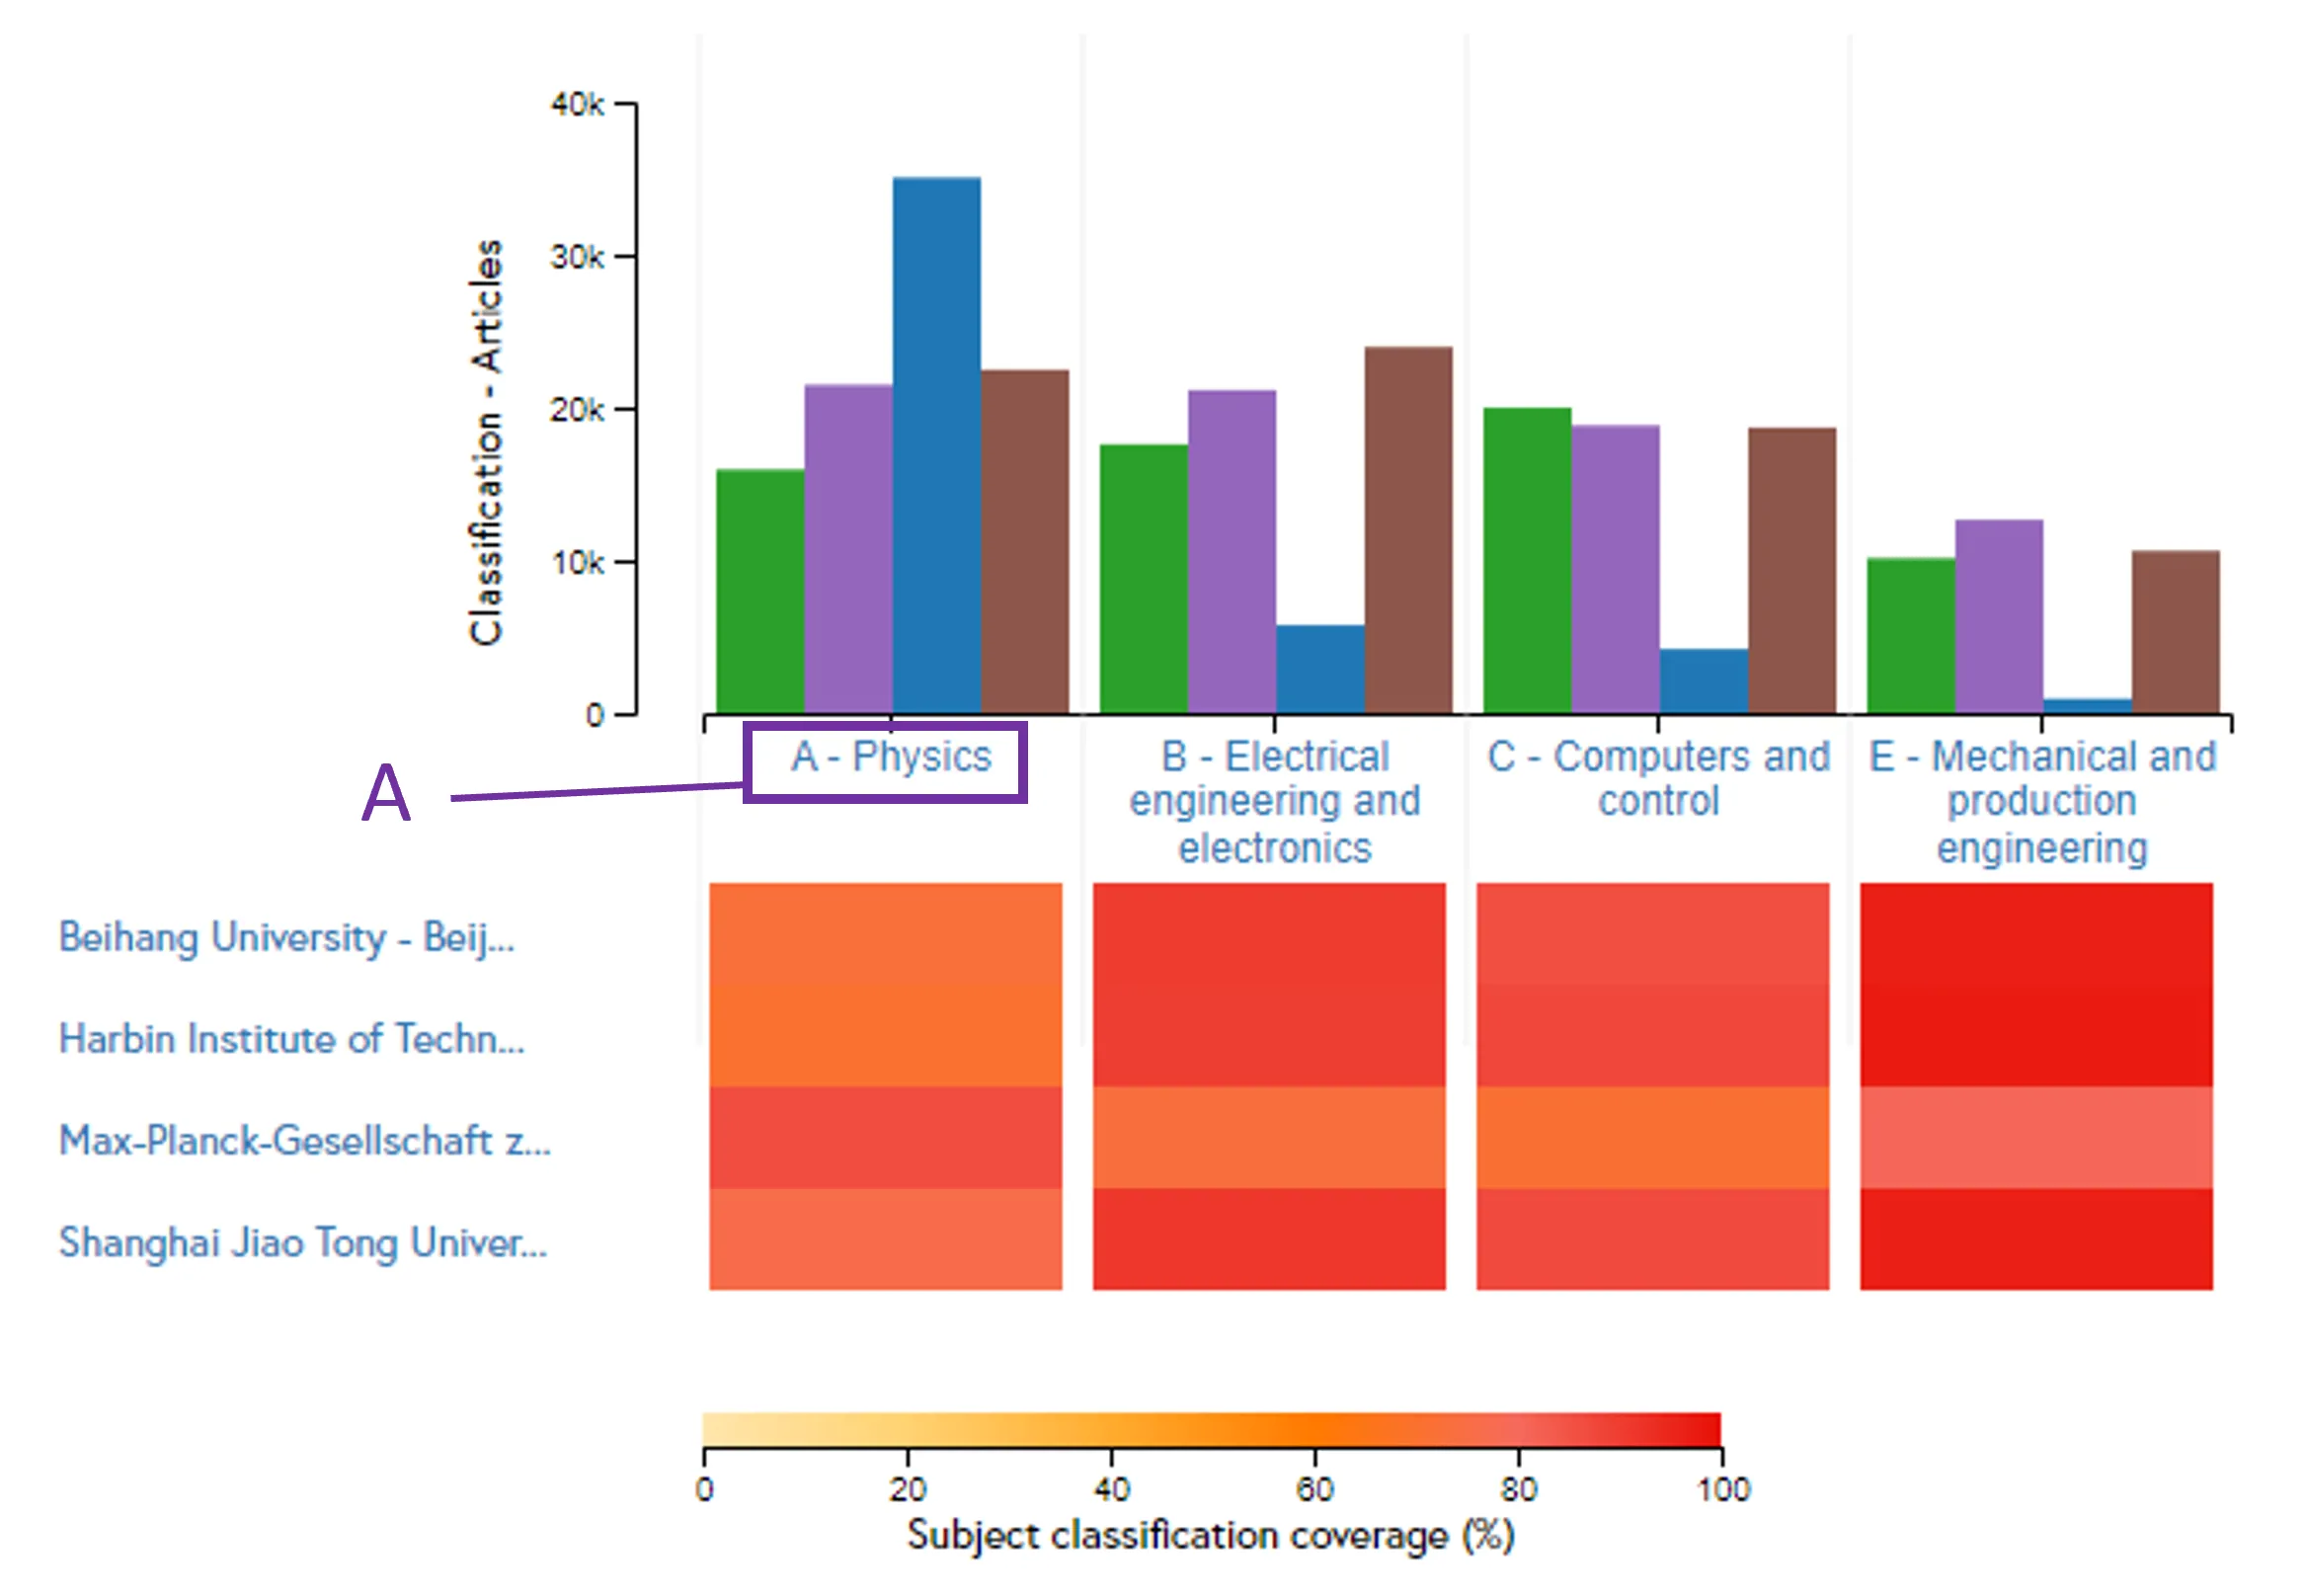
Explore Classification Hierarchy (A): Click on one of the subject classifications to view the next level of detail. You can drill-down through up to 5 levels of classification codes to compare organisations at broad or niche levels.
For example:
-
Electrical engineering and electronics
-
Power systems and applications
-
Generating stations and plants
-
Thermal power stations and plants
-
Gas-turbine power stations and plants
-
-
-
-
Exporting your insights
Click on "Export as PDF" at the top of the page to download your current view. The PDF includes a link to your view so you can see return directly to the data in the future.
Inspec Analytics Plus only: You can also choose to download your insights as an Excel file.